What Savee is about:
Savee is an application my team has created for the NUS module CS2113T on Software Engineering Principles and Object Oriented Programming. Savee’s main target audience are students who need help managing their finances and likes typing. In Savee, there is a command box for inputting commands and graphic user interface(GUI) created using JavaFX was also used to display the output of the system to create a more intuitive and engaging user experience.
Summary of contributions
Throughout this development cycle, I have made much contributions to the team and below shows a summary of my contributions.
Application Code related contributions
-
Major Enhancements: Facilitated the morph from AddressBook Level 4 to Savee
-
Reason for the enhancementSavee is mainly targeted at users who wants to store and keep track of their daily financial activity, which is not the same as AB4. -
My contributionsI adapted all model and storage components. I also fixed all the tests that broke as a result of the morph.
-
-
Major Enhancements: Added a feature that allows users to display a summary of their expenses and income by day, month and categories in a table
-
Reason for the enhancementUsers want to have a way to track daily or monthly financial activities without having to go through the list. -
Brief DescriptionTo see the summary within any date range, the user needs to enter 2 dates or 2 months and the corresponding parameters and the system would generate a summary table. -
My contributionsI created the framework for this feature. It covers many components comprising of parsing, data manipulation, logic and graphic user interface as output. The report was generated on a table panel which can be switched around with other user interface panels as necessary. I created all java logic components and the Java fxml layout files.
-
-
Major Enhancements: Added a feature that shows the breakdown of financial activity into categories
-
Reason for the enhancementSavee also allows users to tag each financial activity with a tag that they can define. These tags can be used for analysing financial activity. -
OverviewTo further empower users to make informed choices, the statistics feature was designed to provide a detailed breakdown of all financial activity within a given period. -
My contributionsFor this feature, there were 3 main parts, logic for the command, model to support statistics and the GUI. I created all the components necessary for this feature, with the most noteworthy implementation being user interface. Similar to summary, the Ui panel in this feature can be switched out for other panels. The pie charts used were generated using JavaFX pie chart library. However, I overwrote some parts of the in to allow for greater functionality using Java’s overriding feature.
-
-
Minor Enhancements: Added a welcome panel that displays breakdown for current month
-
Reason for the enhancementUsers may want to get a sense of their current financial status without having to type a single command. -
My contributionsI created a system to track the current date and refresh the UI panel whenever it detects changes to the underlying list.
-
-
Minor Enhancements: Added an extension to list command
-
My contributionsListCommandParser of the original implementation was tweaked slightly to allow additional functionality.
-
-
Code contributed can be found here: https://nuscs2113-ay1819s1.github.io/dashboard/#=undefined&search=tenvinc
Non-enhancement related contributions
-
Project management
-
Managed releases for 4 milestones(
v1.0-v1.3) -
Set up a workflow where pull requests are automatically blocked unless there is one other person who approved the request
-
-
Tools
-
Set up Continuous Integration, coverage tools and github website deployment
-
PRs reviewed(with non trivial comments)
-
-
Testing
-
Wrote extensive tests to increase coverage of the project
-
-
Documentation
-
Did a few cosmetic tweaks to the User Guide
-
Organised and ensured that documentation is coherent
-
Contributions to the User Guide
Below are some of my contributions to the User Guide. These show that I am able to write comprehensive User Guides. |
Data Analysis Features
This section describe features for the user to analyse his/her financial status in greater detail.
Showing a summary table of all financial activity in a time period: summary
Shows a summary table listing by day, month or categories within a given time specified by the user.
A summary is an item that contains information on the date or month that is represented, the total expense calculated, the total income calculated and
the net money flow calculated. A category refers to any set of tags that are assigned to any records in the application.
The summary command supports both listing by date, by month and by categories.
Format:
-
By Date:
summary date d/START_DATE END_DATE -
By Month:
summary month d/START_MONTH END_MONTH -
By Category:
summary category d/START_DATE END_DATE
Examples:
-
summary date d/1-1-2018 12-12-2018 -
summary month d/apr-2018 sep-2018 -
summary month d/APR-2018 SeP-2018 -
summary category d/1-1-2018 12-12-2018
Showing a breakdown of total expenses and income into categories: stats
Shows a breakdown of total expenses and income into categories and displays these information in a pie chart.
Format:`stats d/START_DATE END_DATE`
Once the command has been executed, 2 tabs will appear showing a pie chart containing data that is relevant in the range.
At the same time, currently selected record will be unselected to reduce confusion for the user. If there are many categories shown and
the box is not large enough, you can use the scroll bar at the side of each legend to view the other categories which are not in view.
| Due to label constraints, some labels may not be displaying correctly if they are overlapping with other labels. This happens when the pie slice is too small. To improve readability, we have decided to hide some labels in such scenarios. Also, when the label is too long, since the pie charts need to fit the labels, the pie chart may become small as a result. To prevent such situations, please keep your labels short. This will be improved in later versions of the product to remove the labels completely and use a mouse over input instead. |
Contributions to the Developer Guide
Below are some of my contributions to the Developer Guide. These show that I am able to utilise modelling tools such as UML diagrams, sequence diagrams, activity flow which are crucial to Software Engineering Principles to illustrate to potential developers the architecture of my product. |
View summary feature
This feature allows the user to view a summary table of all their financial activity within a period of time. There are 3 different ways the user can view the summary, one is summary by date which means the summary of each day in the period will be provided, summary by month or summary by category.
The corresponding command required for this feature is summary and the user will have to supply 2 dates and a compulsory parameter mode which determines whether
they are viewing summary by date, by month or by category. This feature involves most components of FinancialPlanner with the exception of Storage. It can also be broadly split into
2 phases, the logic phase which generates the summary and the UI phase which allows users to view the summary in a table.
As shown below, SummaryByDateCommand, SummaryByCategoryCommand, SummaryByMonthCommand is a type of SummaryCommand and thus inherits from SummaryCommand. The rationale behind this design choice is that
code shared by these classes can be placed in SummaryCommand for code reuse. This makes it easier for future developers to easily extend this functionality.
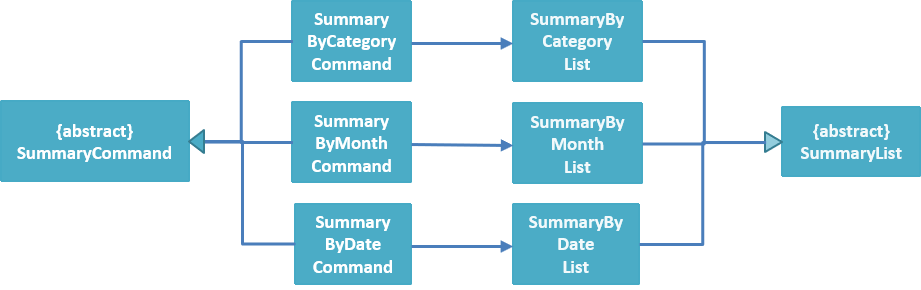
Also, these commands utilise their own version of summary lists which is also inherited from the parent class SummaryList as shown below. Below details the logic phase.
-
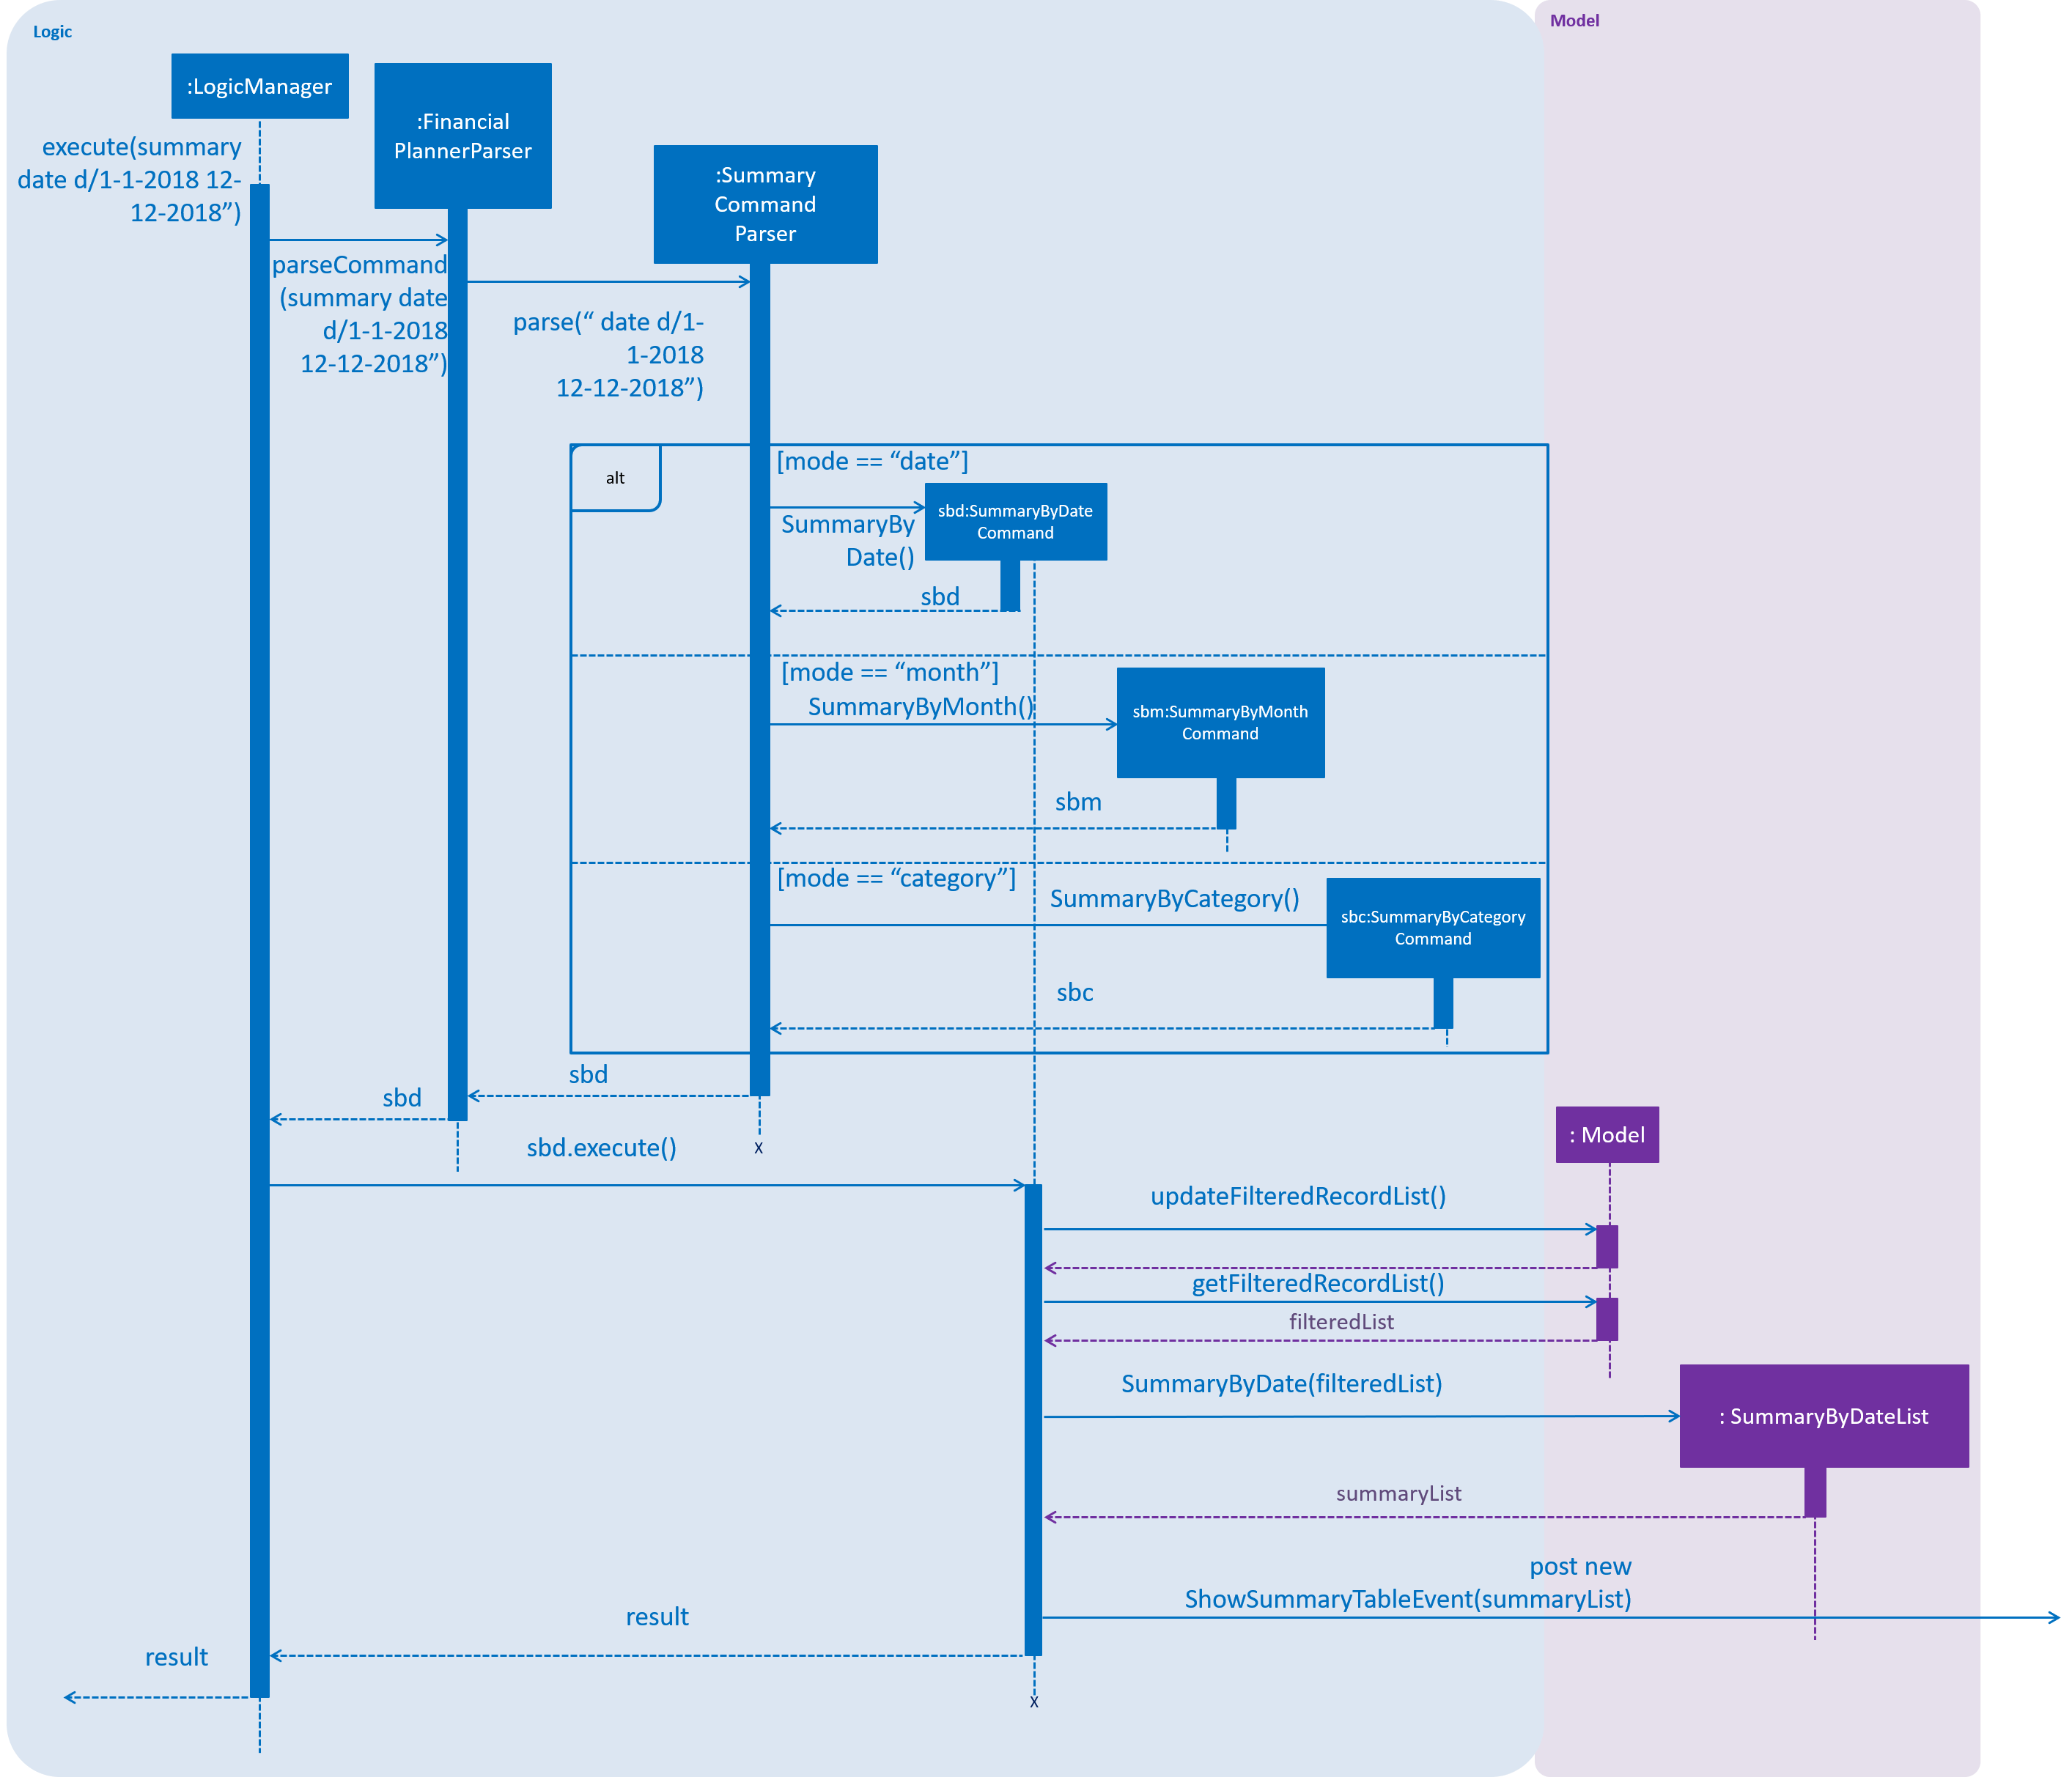
When the user types in the command "summary date d/1-1-2018 12-12-2018", the command is passed from LogicManager to FinancialPlannerParser. In here, the system chooses which parser to use and calls its parse method which is polymorphic, meaning that every parser has the same function but use different implementation.
-
In this class, based on the
modeparameter given, the system chooses a SummaryCommand to instantiate and pass the reference back to the Logic Manager. The various checks for the validity of the parameters also occur during this stage. -
After the SummaryCommandObject is created,
SummaryByDateCommand#executeis called. The responsibility of SummaryByDateCommand is a manager that has retrieves information from model and passes it to other components. SummaryByDateCommand gets the filtered list from Model usingModel#getFilteredRecordListand passes it to the constructor of SummaryByDateList. The createsSummaryListobject which is then passed into aShowSummaryTableEventbefore triggering the event. -
The entire logic process is the same for SummaryByMonthCommand and SummaryByCategoryCommand but uses different lists.
The sequence diagram below details the sequence of program executions for the logic phase.
The next phase of the program execution is performed in the UI components.
-
MainWindowwill listen for theShowSummaryTableEventand render all Main UI panels invisible before renderingStatsDisplayPanelvisible. -
It then calls the handler function in
StatsDisplayPanelwhich will create tabs and call the constructor ofSummaryDisplay. -
Within the constructor of
SummaryDisplay, the table is created and the SummaryList is converted into a Ui friendly list.
Design Considerations
Aspect: Method of generating the summary
-
Alternative 1 (current choice): Generate the summary list whenever the summary command is called.
-
Pros: Easier to implement and maintain. Sufficient for the intended target audience of FinancialPlanner.
-
Cons: This requires looping through each record in the filtered record list obtained from the
Model. To aid in the time complexity, the internal implementation of SummaryList was done using hash maps instead which allowed for constant time random access.. However, the initial filtering is close to linear time complexity which could slow down the app if many records are inside. Also, the list had to be created every timesummaryis called which could be slow if the command is called multiple times.
-
-
Alternative 2: Morph the record list into a record hash map of record lists instead
-
Pros: A hash map allows for constant random access to a record list of a particular date assuming the key for the hash map is using dates. Thus, the filtering function does not need to loop through as many records and the time taken would be lower especially when the database in the application is large.
-
Cons: Might be too specific to only 1 type of category like categorising by date. If any other types are required, another map may have to be added. This implementation may make the system rigid and hard to modify in the future.
-
-
Alternative 3: Cache the summary list in financial planner
-
Pros: By caching the summary list in the financial planner and assigning a boolean variable along with information on the filter predicate to it to determine if it is modified, we can reduce the number of times summary list is recreated every time the
summarycommand is called. When thesummarycommand is called, it checks the boolean variable to see if summary list needs to be modified. If it doesn’t need to be regenerated, the system will simply read directly fromModelManager. -
Cons: This implementation involves tracking of the state of the summary list. If it is not done systematically, it may have some hidden bugs which can be hard to test. Also, if the sequence of commands is as follows, summary, add, summary, the time required is still long.
-
View category breakdown feature
Current Implementation
This feature allows the user to view a pie chart breakdown o f all expenses and all income within a date range which the user can specify.
The corresponding command required for this feature is stats.For this feature, users have to enter 2 dates, one starting date and one ending date.
This feature is facilitated by a few key components of FinancialPlanner, Logic, Model, UI and function executions can be split into 2 phases, the Logic phase and the UI phase.
The detailed execution sequence of functions used for Logic phase are as shown below.
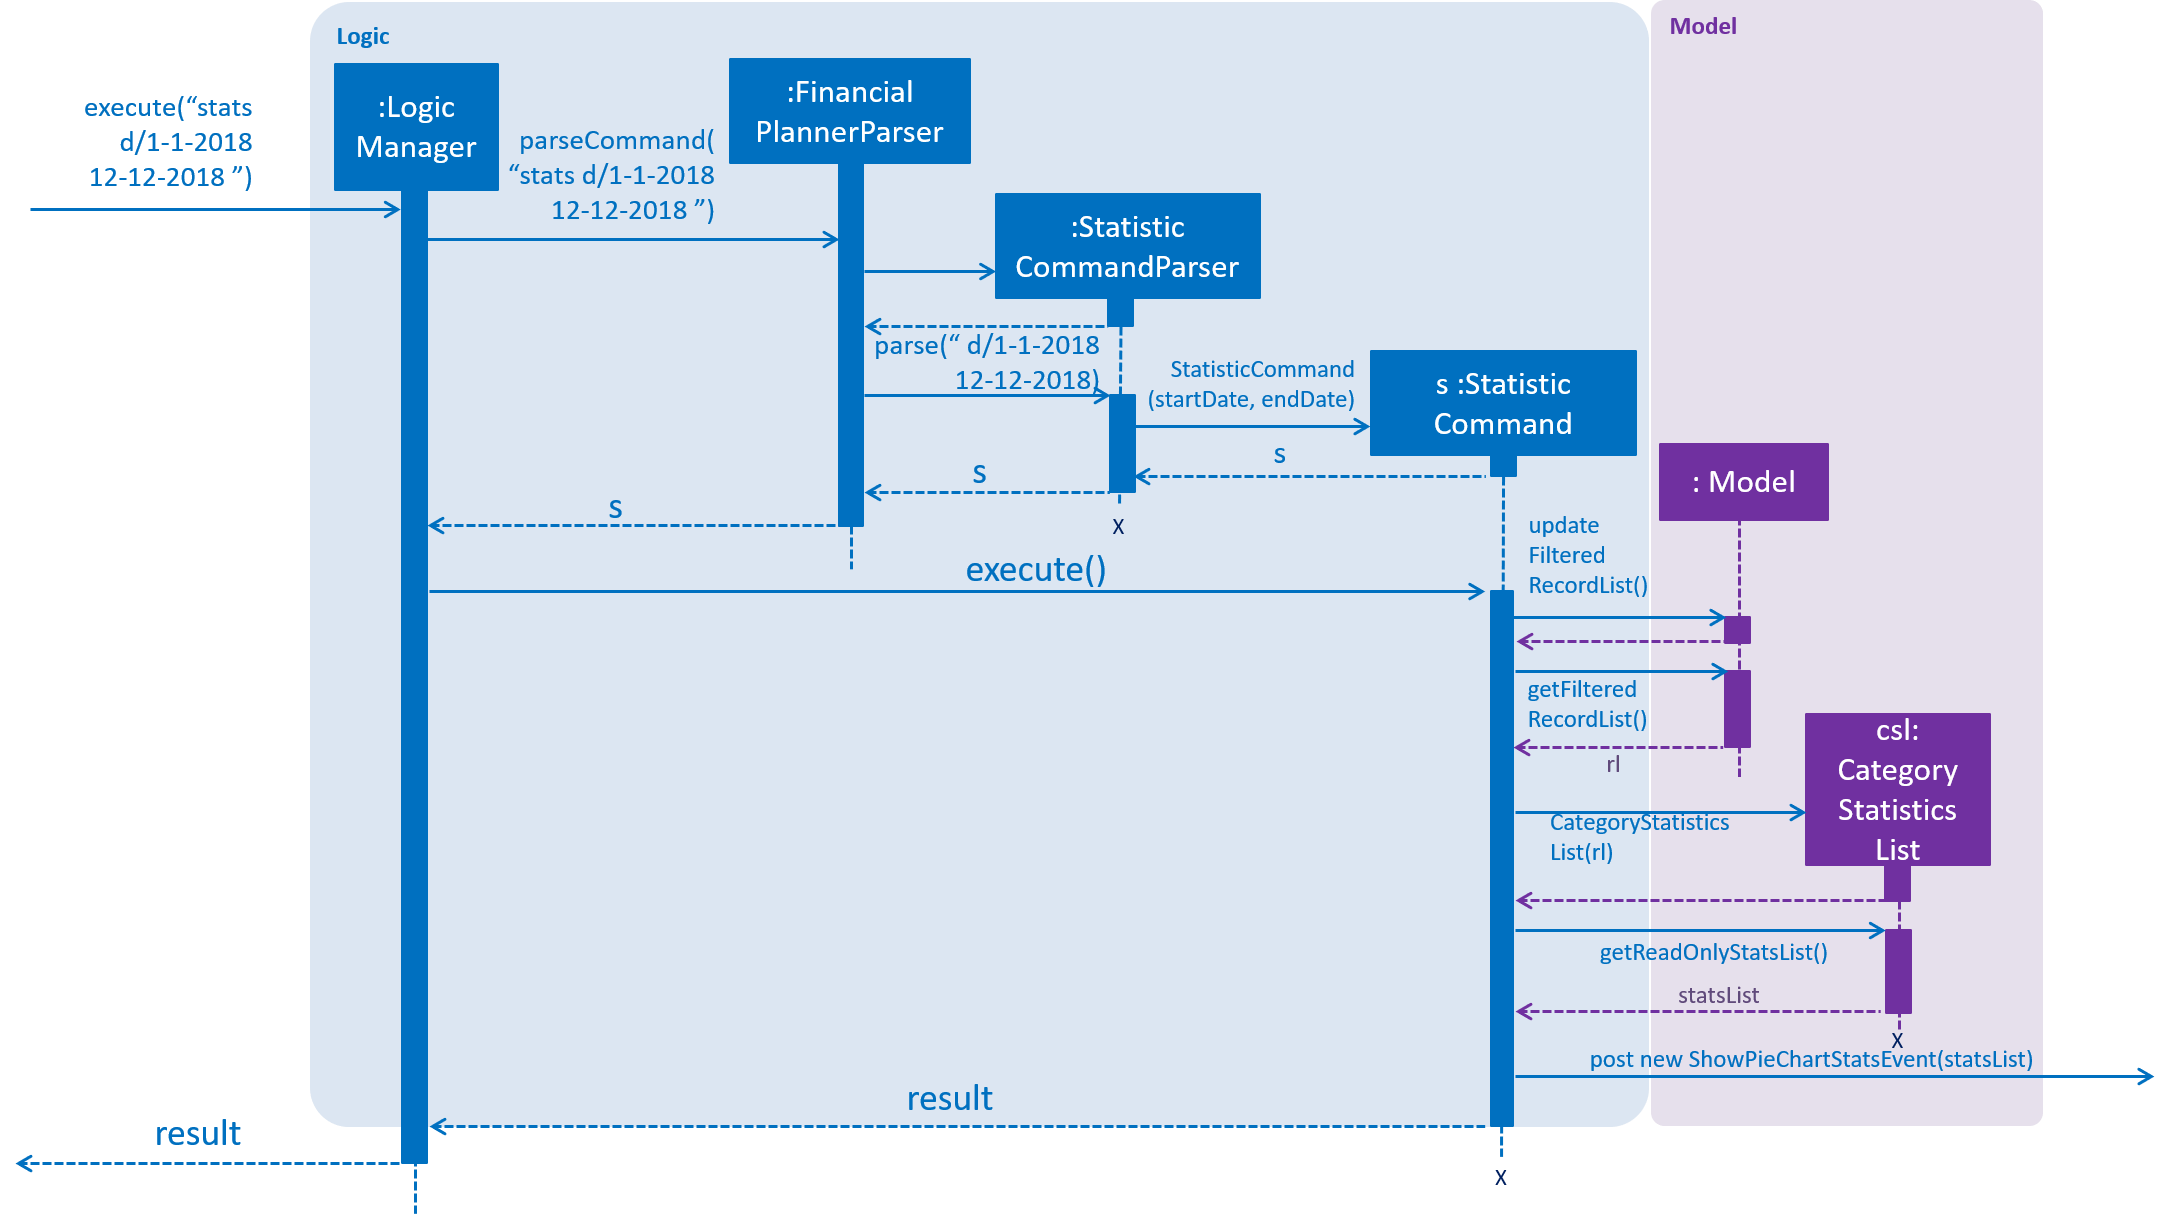
Consider the situation where the user enters "stats d/1-1-2018 12-12-2018":
-
When user enters the command, the
LogicManagerrecognises the command and calls theFinancialPlannerParserto process the new command as shown above. -
The FinancialPlannerParser will then search for the
statskeyword required and once it is found, the rest of the command minus the keyword is passed in as a parameter to StatisticCommandParser. -
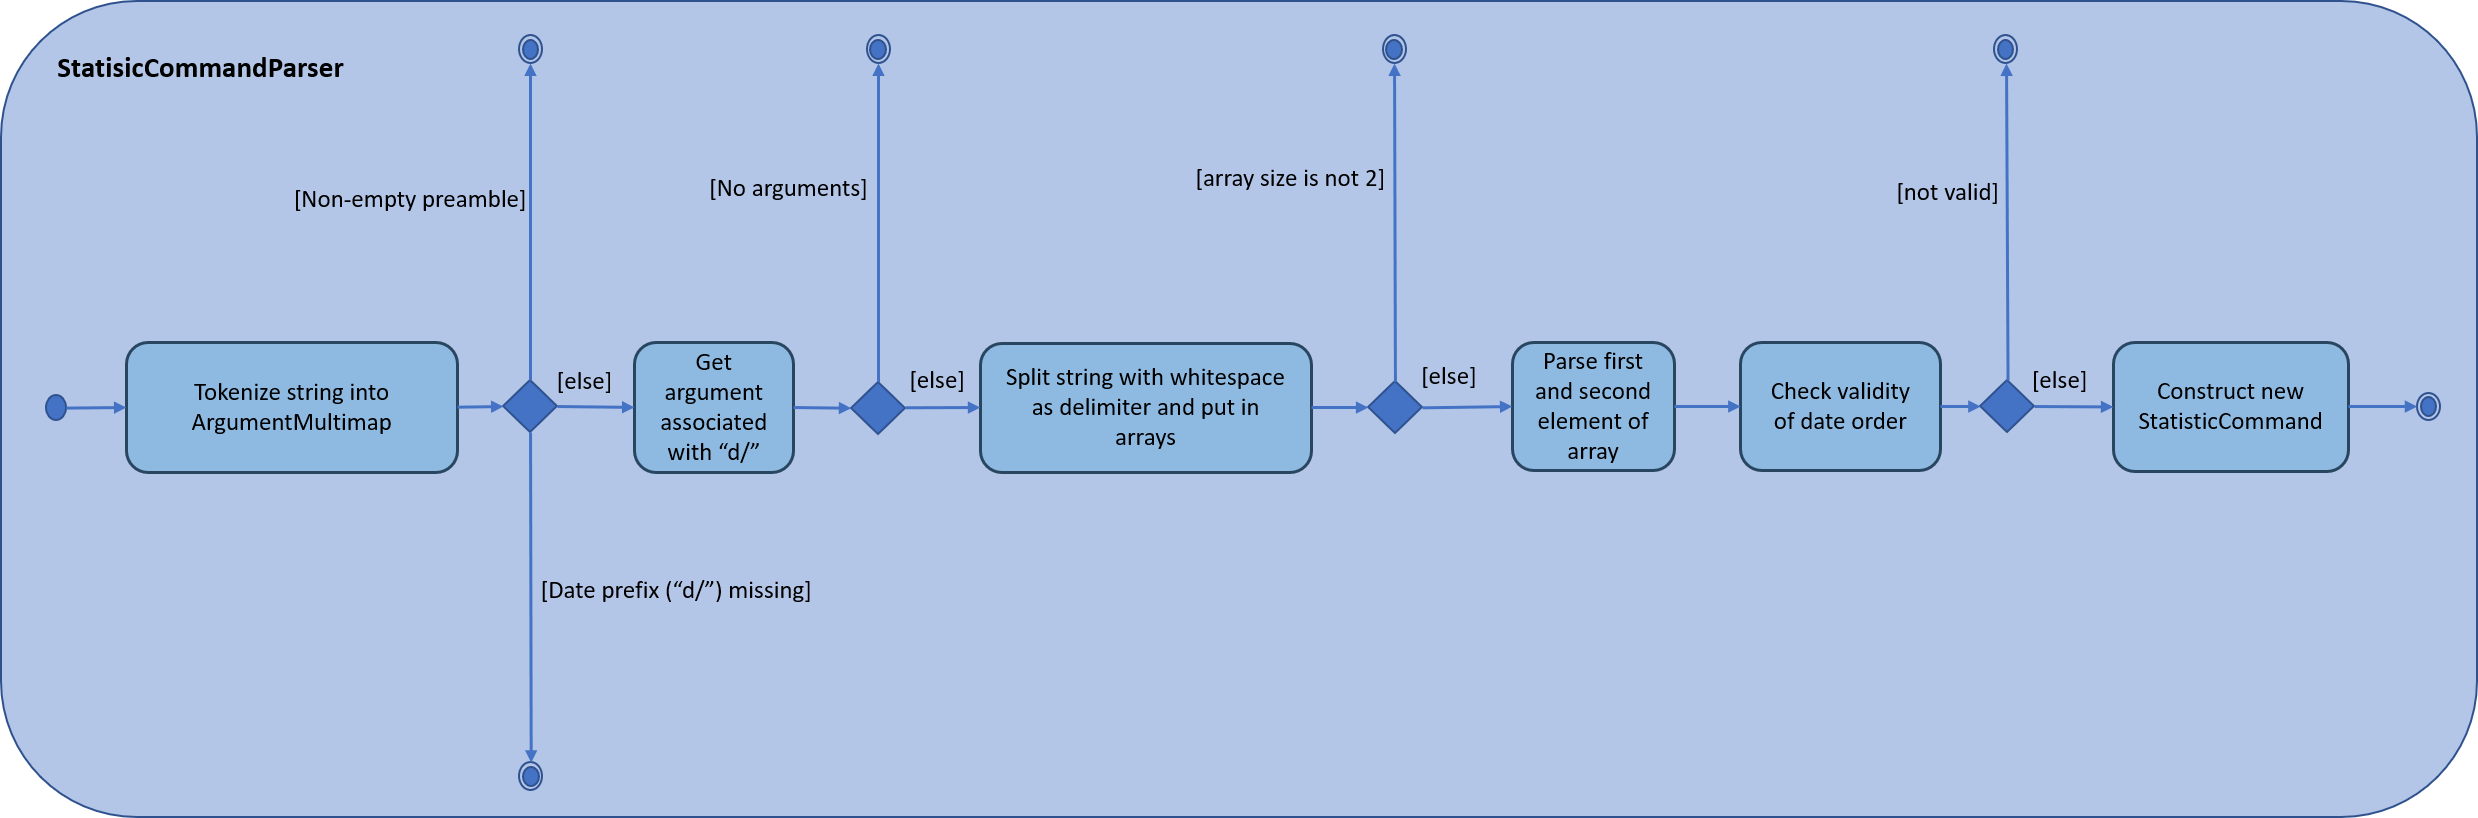
The StatisticCommandParser will then parse the arguments and create a new StatisticCommand object before returning its reference. The activity diagram below details the mechanism within the
StatisticCommandParser#parsemethod.
-
Once
StatisticCommand#executeis called, it will then search through the in-memory data of FinancialPlanner and return a list containing all records within the date range and including both the start dates and end dates. This functionality is facilitated by theModelManagerwhich is the class that manages all interactions betweenLogicandModelcomponent, by`ModelManager#updateFilteredRecords`. The command then retrieves the filteredList from ModelManager and passes it into the constructor ofCategoryStatisticsList. -
In this constructor, it will loop through all the records in the list and add them into an internal map. The internal data structure in
CategoryStatisticsListis a hash map, to aid in the adding process, however it only outputs lists and not the map. This functionality is facilitated byCategoryStatisticsList#addToCategoryStatisticswhich checks whether the record is in the map. -
If the record is not present, it creates a new
CategoryStatisticobject and adds that to the map. If the record is present, the record is then added to the existingCategoryStatisticobject. -
The flow of control returns to StatisticCommand and StatisticCommand calls the read function of CategoryStatisticsList to obtain a read-only list and passes it into an event constructor before posting the event
ShowPieChartStatsEvent.
After the event is posted, the execution proceeds to the UI phase where there is a listener in MainWindow listening to this event. This is facilitated by
the event system in FinancialPlanner. The sequence diagram below details the program flow of the functions executed in UI phase for creating the pie chart for total expense.
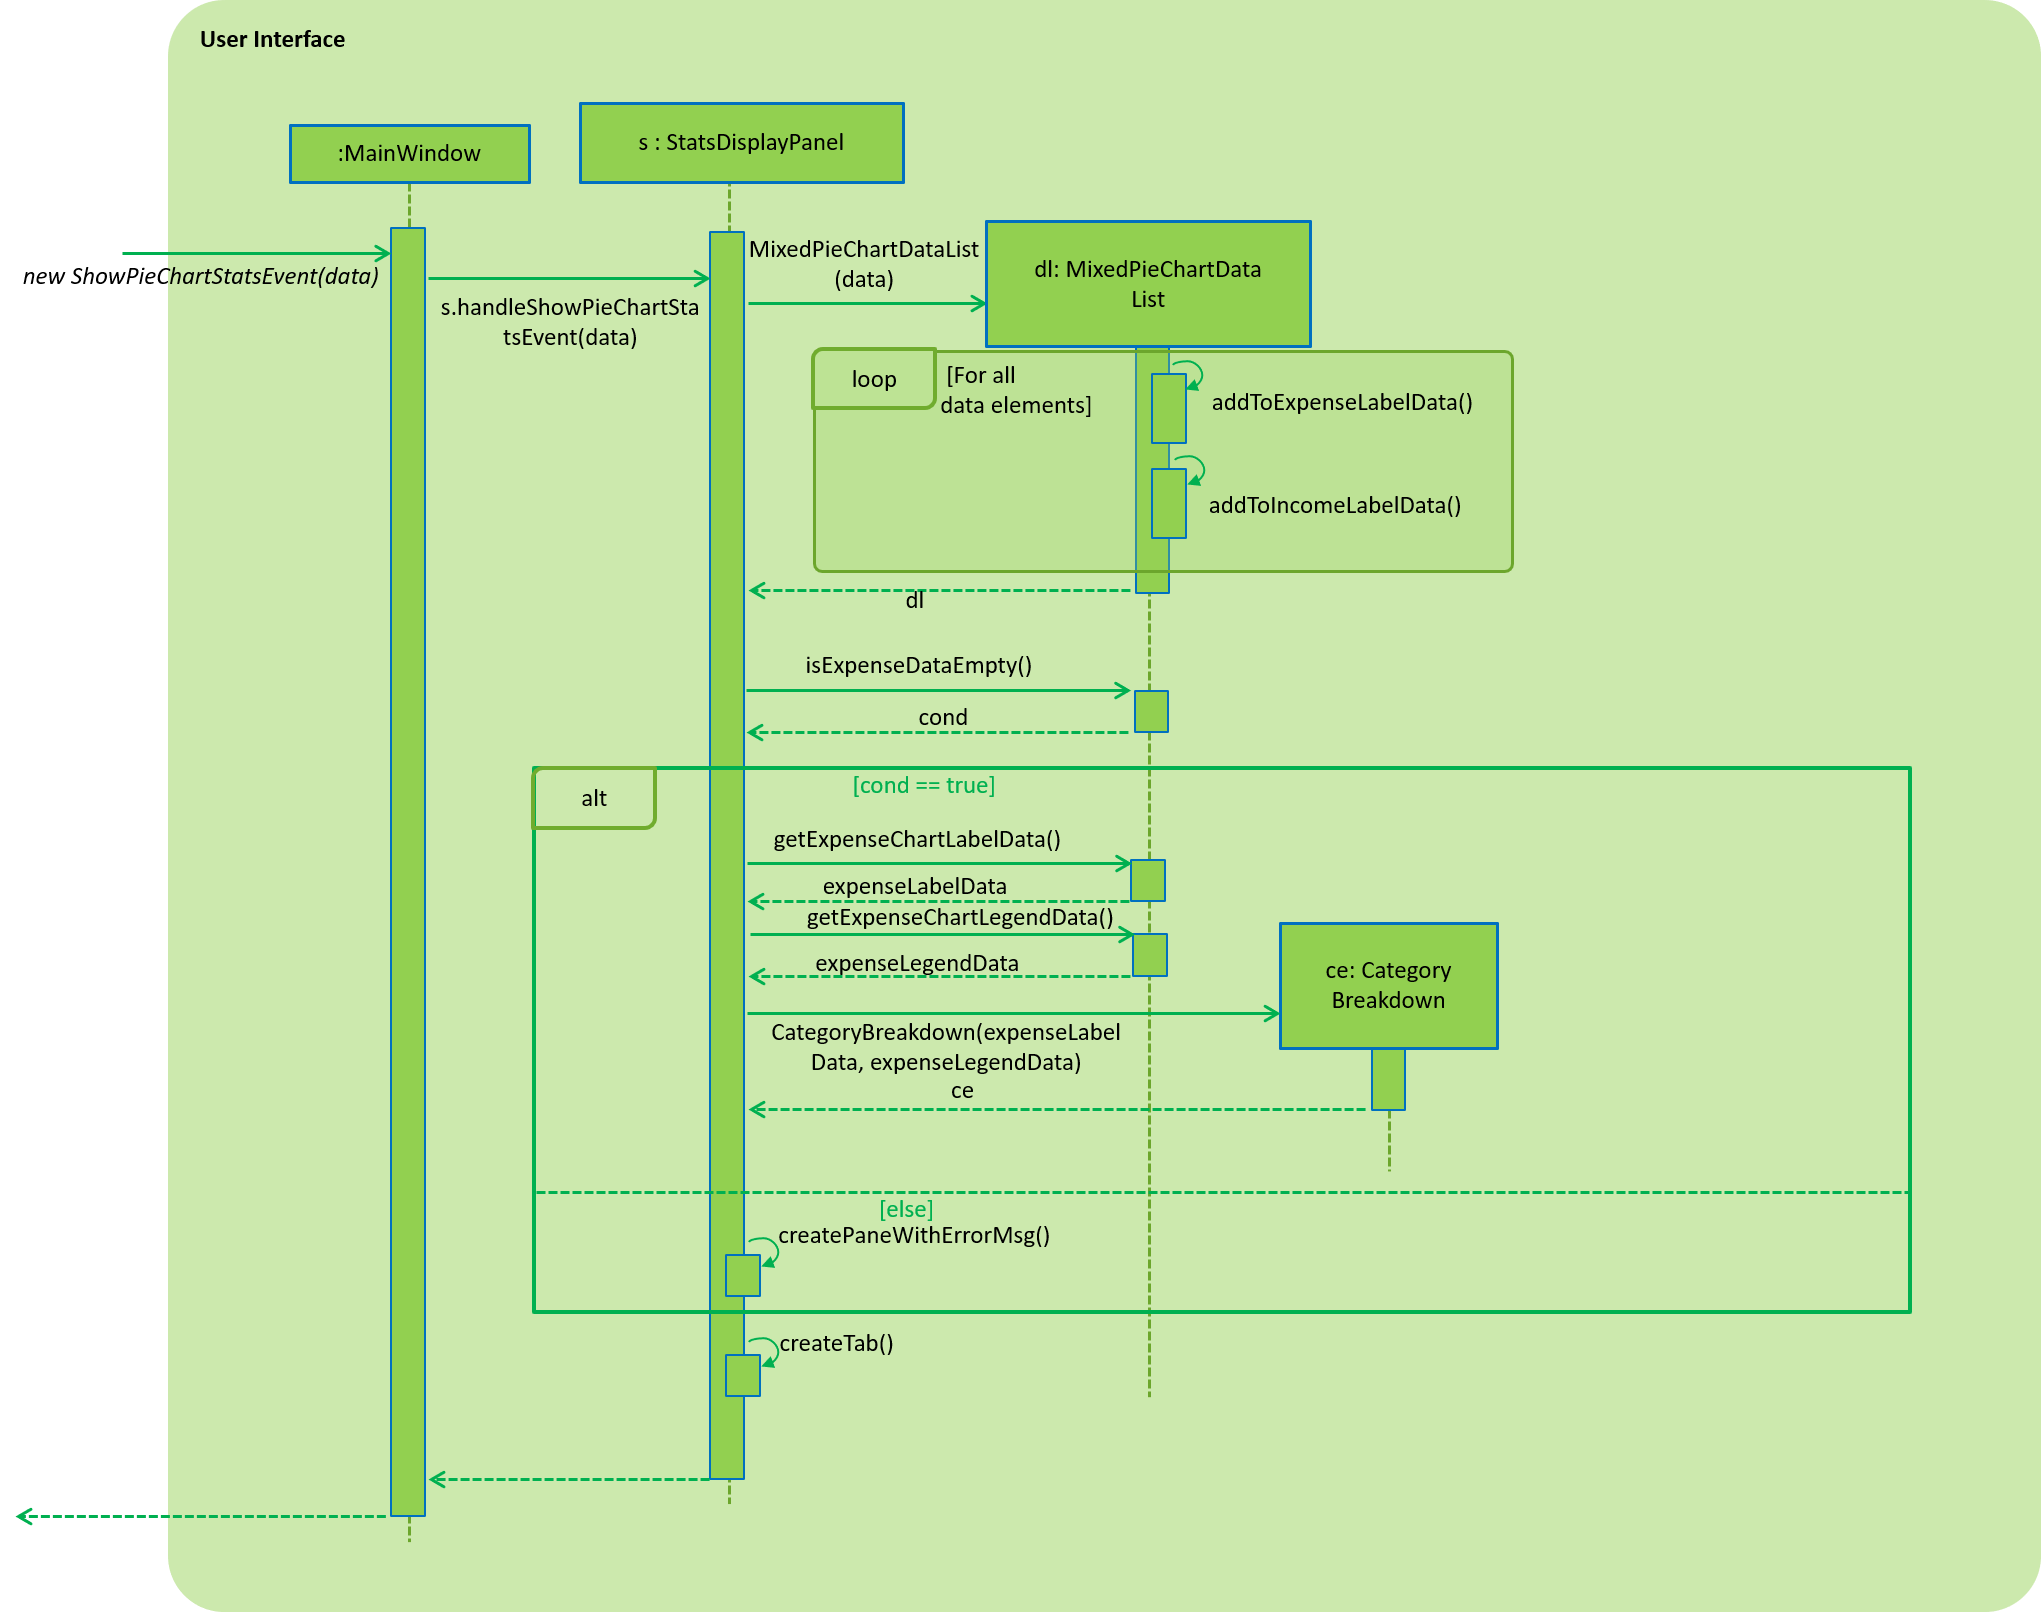
-
When the event is caught by the listener in
MainWindow,MainWindowlooks through all children of theMainWindow#mainUiPanelPlaceholderand executes the hide function in them. This will make all children hidden from view in the UI which ensures that the UI is displayed correctly. -
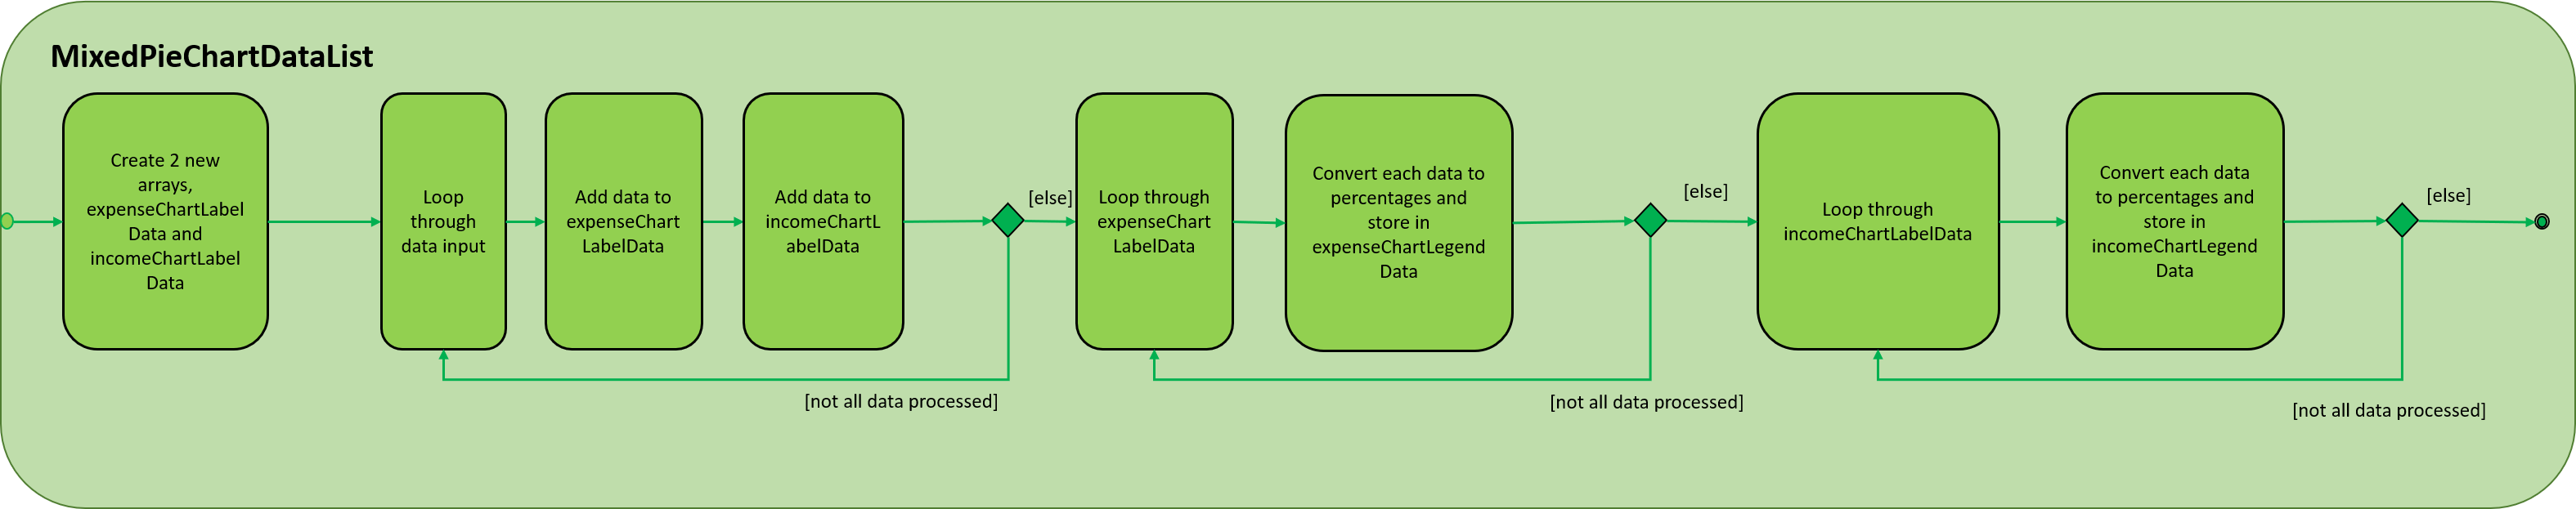
As shown above, the function
StatsDisplayPanel#handleShowPieChartDataEventis called which will call the constructor ofMixedPieChartData. The detailed execution details within this class is as shown in the activity diagram below.
The program flow is then as shown above where the CategoryBreakdown is created and instantiated with 2 lists, one being expenseLabelData and other being expenseLegendData.
In the current implementation, whenever stats is called, 2 tabs will be created, one for total income and one for total expense. Thus, the same program sequence after construction for
CategoryBreakdown is also repeated for total income.
The sequence diagram below details the program flow after the constructor of CategoryBreakdown class is called.
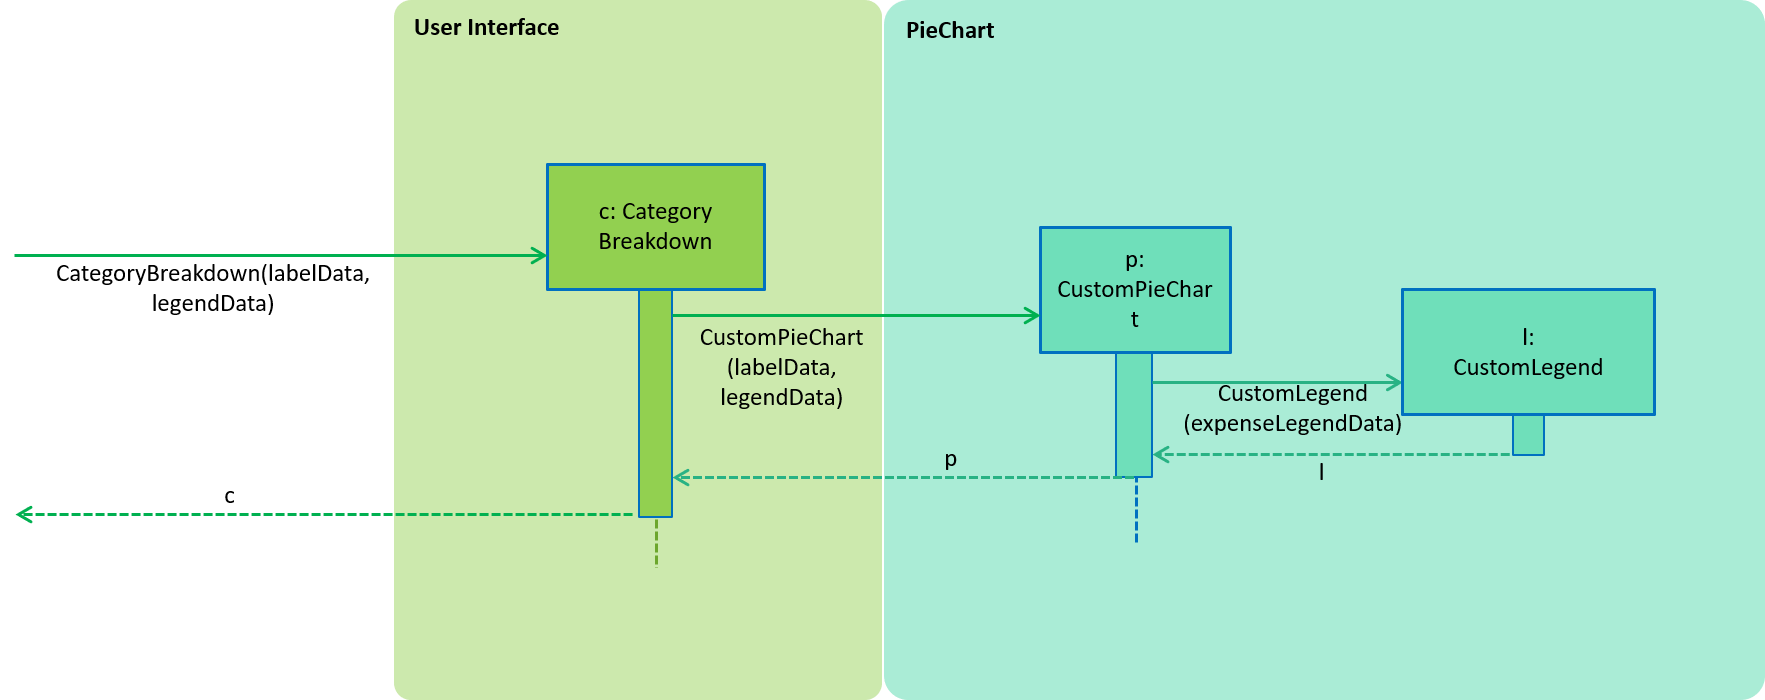
| Note that the CustomLegend class is located within the CustomPieChart class which inherits from the JavaFX PieChart class. This legend class can only be accessed within CustomPieChart for security purposes. |
Design Considerations
Aspect: Data structure to support statistic command
-
Alternative 1 (current choice): The pie chart breakdown is regenerated from the filtered list every time this command is called.
-
Pros: Reduce overhead during normal operations like adding, deleting and editing if we do not have to update the statistics in real time.
-
Cons: If the command is called multiple times, this process could be repeated many times which may make the app sluggish when there are many records.
-
-
Alternative 2: Use a data structure to store the statistic information when there is mutation of data
-
Pros: Since the statistics are constantly updated, whenever the command is called, system can read directly and not have to recompute.
-
Cons: Adds overhead to usual operations. Benefits may not be visible if the command is not called frequently.
-